

Reports
Ready-made reports (activity, hours, to invoice) with Excel and PDF export, plus “My reports”, with charts you build yourself.
Office / administratorSuper AdminOptional module
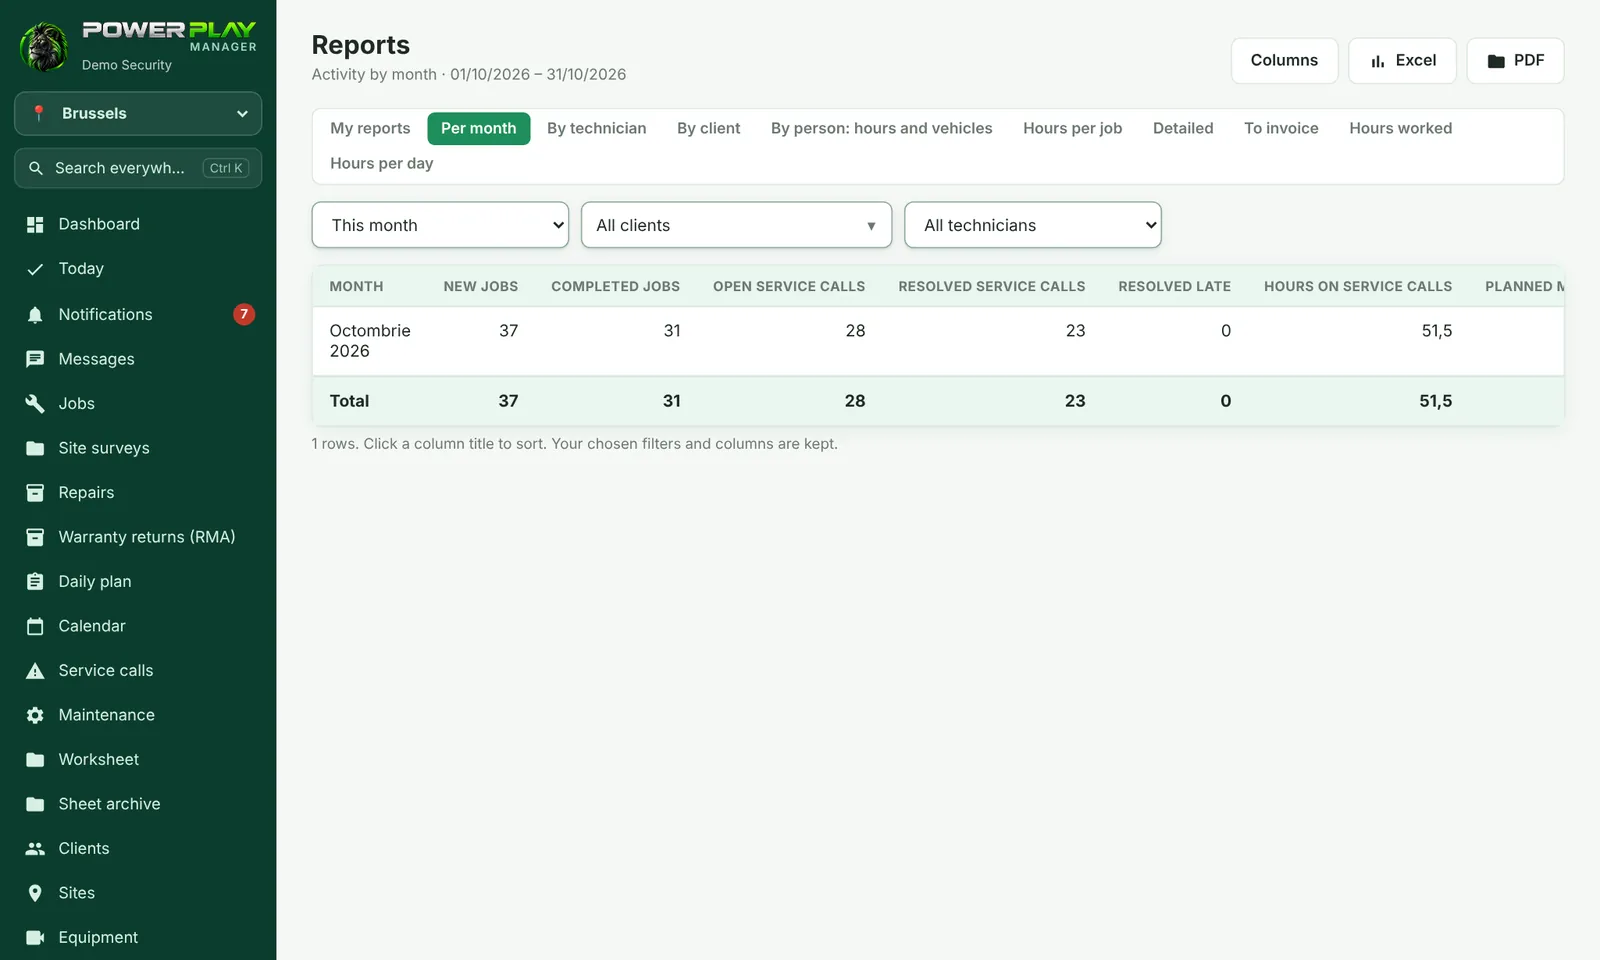
The Reports page (in the Administration menu) shows what was done, by whom, for which client and how many hours. Reports can be downloaded as Excel or PDF.
Ready-made reports
At the top there is a button for each report:
| Button | What it shows |
|---|---|
| Per month | Activity by month |
| By technician / By client | Activity of each technician or client |
| By person: hours and vehicles | Hours, jobs and vehicles per person (from the worksheet or the plan) |
| Hours per job | Hours on jobs, day by day |
| Detailed | Jobs, service calls and maintenance, row by row |
| To invoice | Work done that has not been invoiced yet |
| Hours worked / Hours per day | Hours from the worksheets |
- Open Reports and tap the report you want.
- Choose the period (e.g. This month, Last month, This year or Other period… with dates DD/MM/YYYY).
- If you want, choose a client from All clients and a person from All technicians.
- Tap a column title to sort. With Columns you choose which columns are shown.
- Tap Excel or PDF to download the report, with the columns you chose.
To invoice
- Open the To invoice report and choose Not invoiced.
- Tick the rows you have invoiced.
- Tap ✓ Mark checked ones as invoiced and, if you want, enter the invoice number.
- Made a mistake? Tick the rows and tap Cancel invoicing.
My reports (with charts)
With the My reports button you build your own reports with charts, which stay up to date automatically.
- Tap My reports, then New report.
- Choose What the report is about (e.g. Jobs, Invoices issued, Payments received, Trips) and What you count.
- Choose the period and How you group (by month, by client, by person…). Optionally, Split by colors.
- Under How it looks choose Bars, Line, Pie or Table only. You see the result right away on the right.
- If you want, tick Show it on the Dashboard and Also show it to the other administrators.
- Tap Save report.
Each saved report has the Excel, Edit, ↑ ↓ arrows for order, and Delete buttons. Reports shared by colleagues appear under From colleagues; you can copy them with Copy to me.

Frequently asked questions
Can I give an accountant access to reports?
Yes. The Super Admin creates a role based on Administrator (e.g. Accountant) and leaves Reports and Invoices visible, in Company settings → What each role sees.
Can my colleague see my reports?
Only if you ticked Also show it to the other administrators. They can view and copy it, but not edit it.
Why can't I choose the “Line” chart?
A line shows change over time, so it only works when you group by days, months or years. A pie works only when you group by something (client, person) and don't split by colors.